How to create treemap?
In treemaps, Each data point is displayed as a rectangle, sized and colored according to values that one assign. It shows the relationship between two items and provides distribution and comparision using varying colors or saturation.
Ideata Analytics provides capabilty to create treemap on analysis screen. The steps to create treemap are as follow:
Step 1: Open the datasource which you want to visualize by clicking on its name on connect screen. It will be redirect to analyze screen
Step 2: You will see the columns listed in the left panel in analyze tab of the selected datasources.
Step 3: In top panel, in chart options select the chart which you want to make from chart list. Here select Treemap chart.
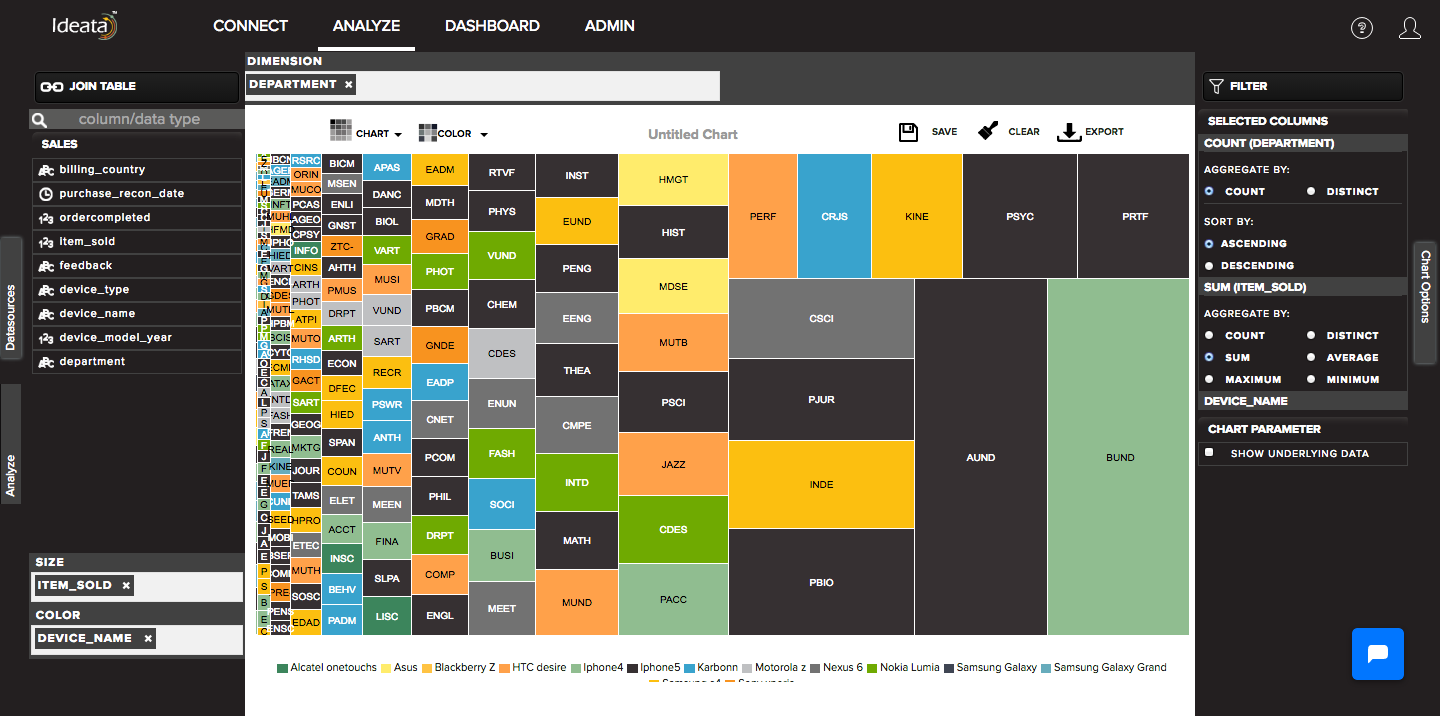
Step 4: Drag and drop required columns in to Dimension,size and color which you want to visualize. Below is its significance -
Dimension - column will be plotted on treemap
Size - size of the boxes will depend on this column
Color - data will be group by the column and will be shown in different colors
Step 5: Treemap chart will be created respectively in the chart area which can be saved or exported.