How to change y axis data format?
When we drag something in measures and if we want to change how the y axis datapoints looks in the chart, we can do it from y axis format options.
It provides various options such as:
add prefix - we can add some text as prefix before y axis datapoints text. For example - add $ before each datapoint such that 1000 appears as $1000
add suffix - we can also add some text or symbol as suffix after the dataspoints text. For example - add Rs. after each datapoint such that 1000 appears as 1000Rs.
We can also apply some mathematical formula such as add, subtract, multiply or divide to change the numbers accordingly in y axis. for example if we get 50000 in y axis we can choose divide by 1000 and change it to 50
round off - if there are decimal points in y axis we can also round them off by selecting round off check box and providing appropriate decimal palces in the text box
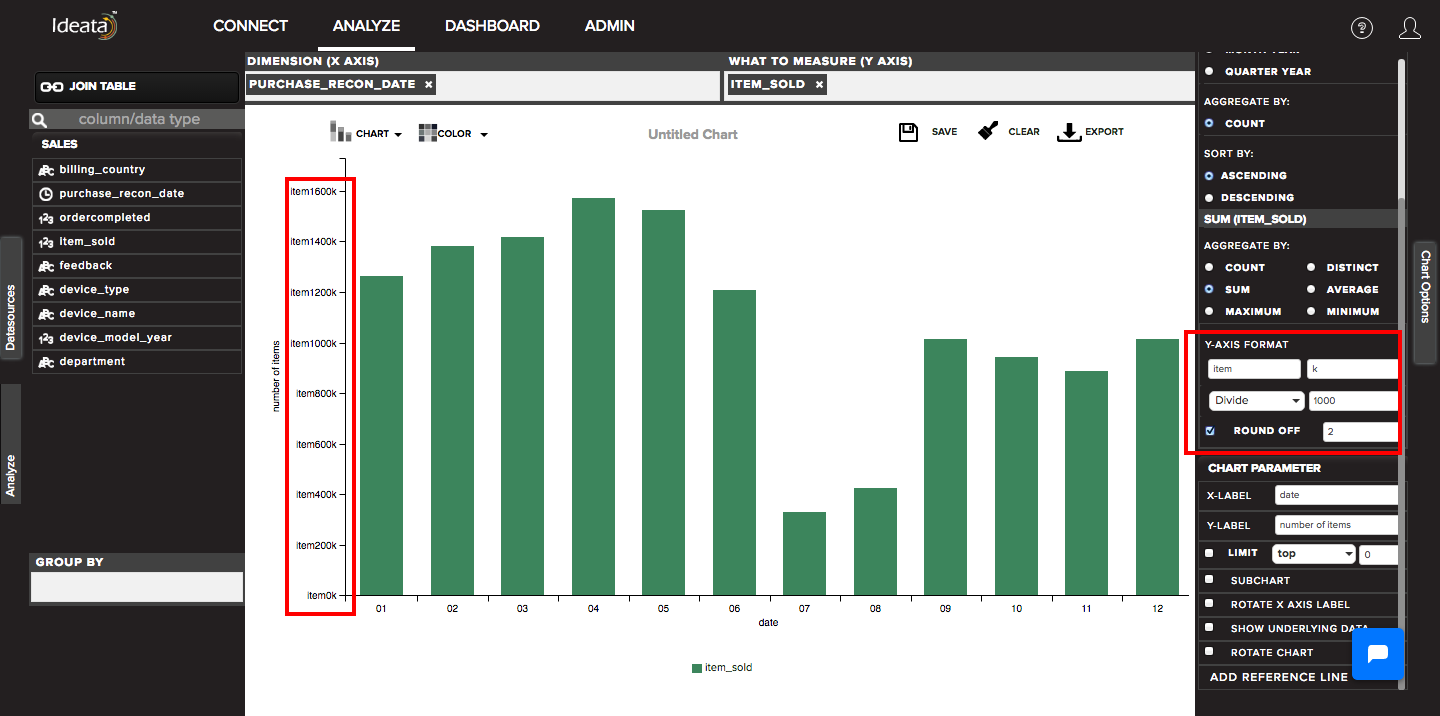 All the changes done in the y axis format will automatically reflect on the y axis in chart area.