How to aggregate data on chart
When we drag some data columns in dimension and measures fields, by default Ideata Analytics application shows us the sum or count if the data column is numeric or count if the data column is text in measures. You can change the aggregation level using the aggrgate by option on the right chart panel.
In case of numeric values in measures, you can chose from other aggregate by options including count, sum, distinct, average, minimum or maximum to perform the required aggregation.
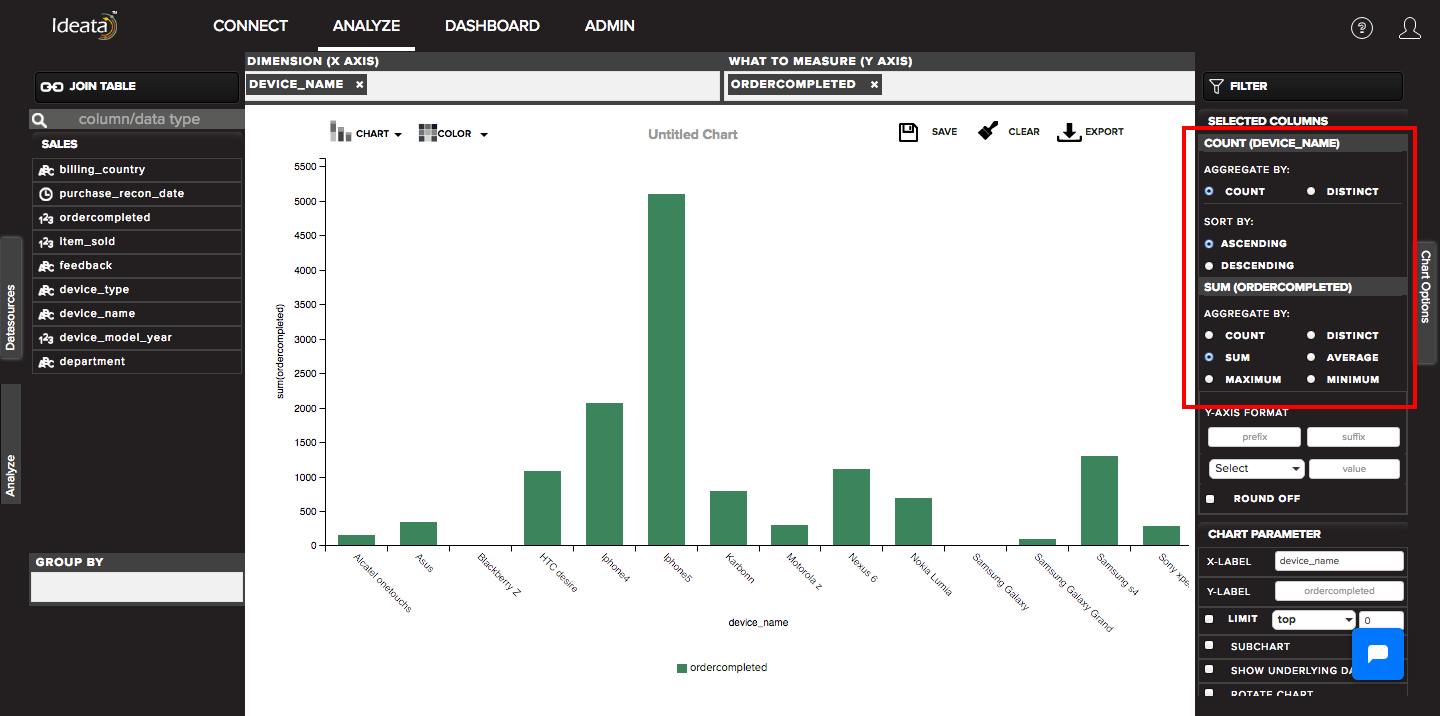
we can select the radio buttons available under "aggregate by" option in order to change the setting and aggregate data in different ways.