How to concentrate on single data point in a chart?
When you create a chart on analysis screen, you can look at a single bar or single datapoint of interest in the chart area. In order to do so you have to click on the particular datapoint in the chart area which will open a small box.
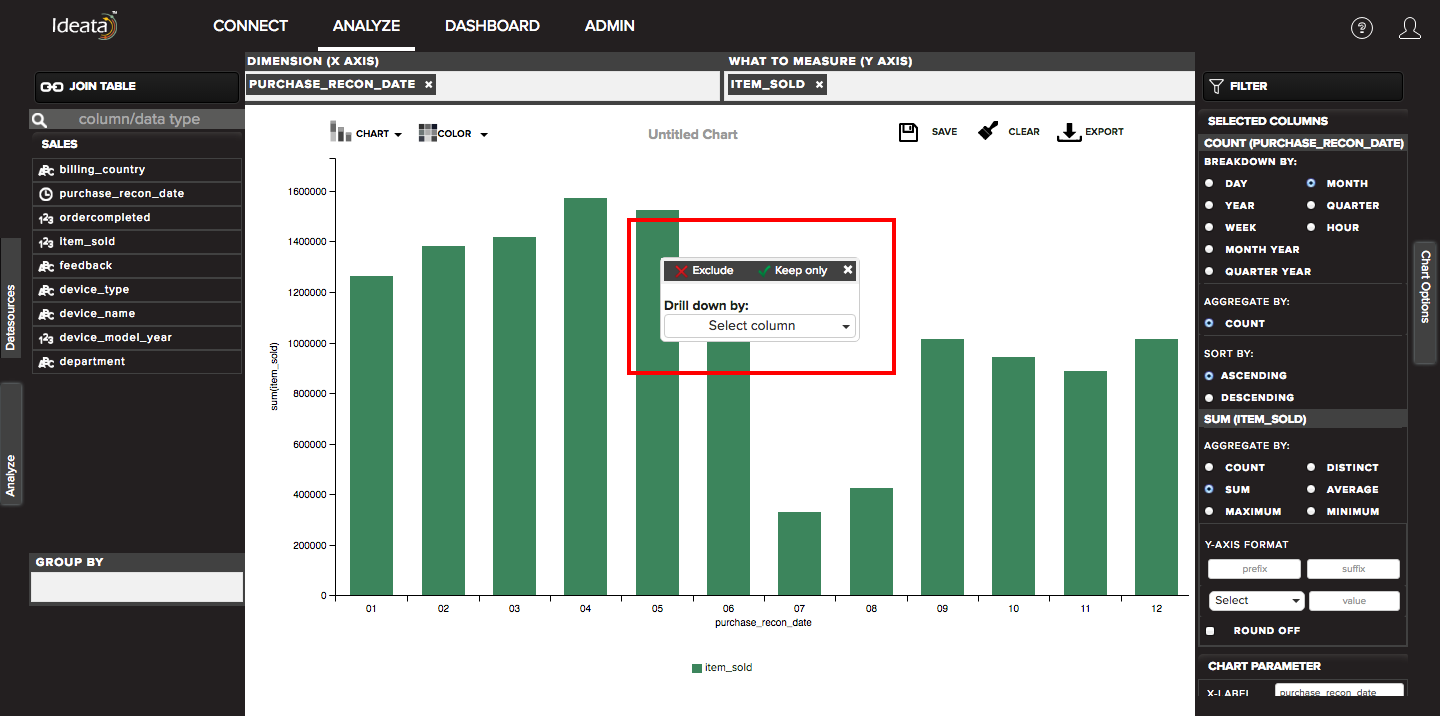
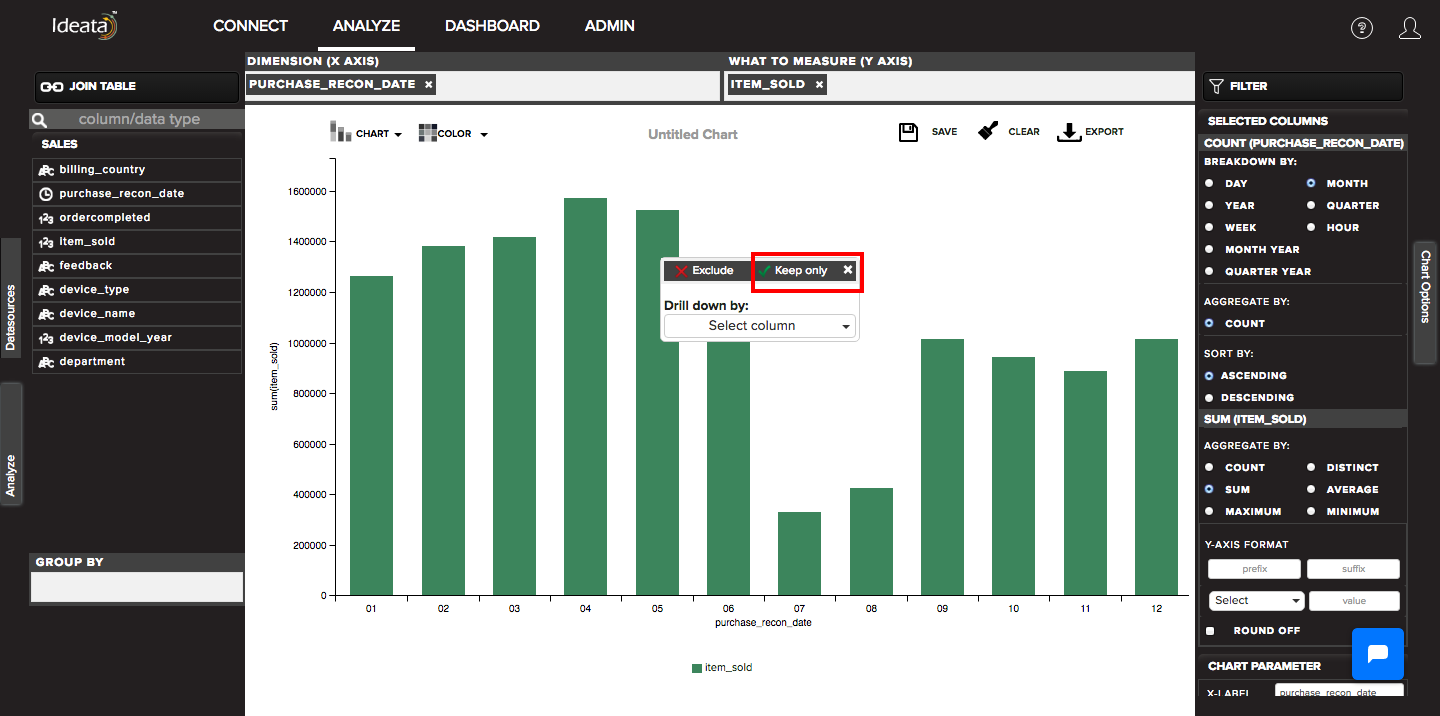
It will have option to include in the form of right check mark. You can click on the include option and the chart will change with showing just the selected datapoint. Basically in the background it is applying filter on the data with the include conditions.
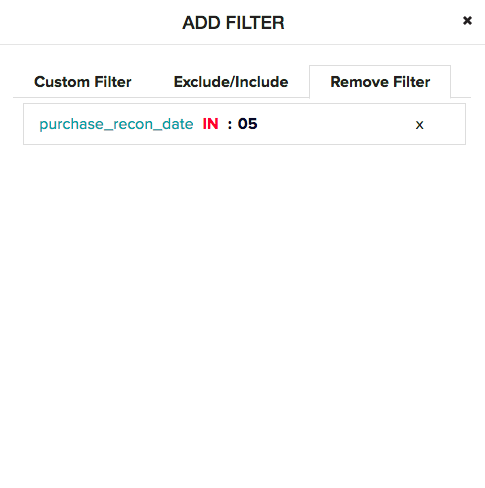
In order to undo the operation we can simply trace it back and remove it from filter option.