How to change chart labels?
We can create different reports and charts on analysis screen. We can also change labels of the x-axis and y-axis of the chart which you created on the analysis screen as you want. Ideata analytics provides mechanism to change these labels
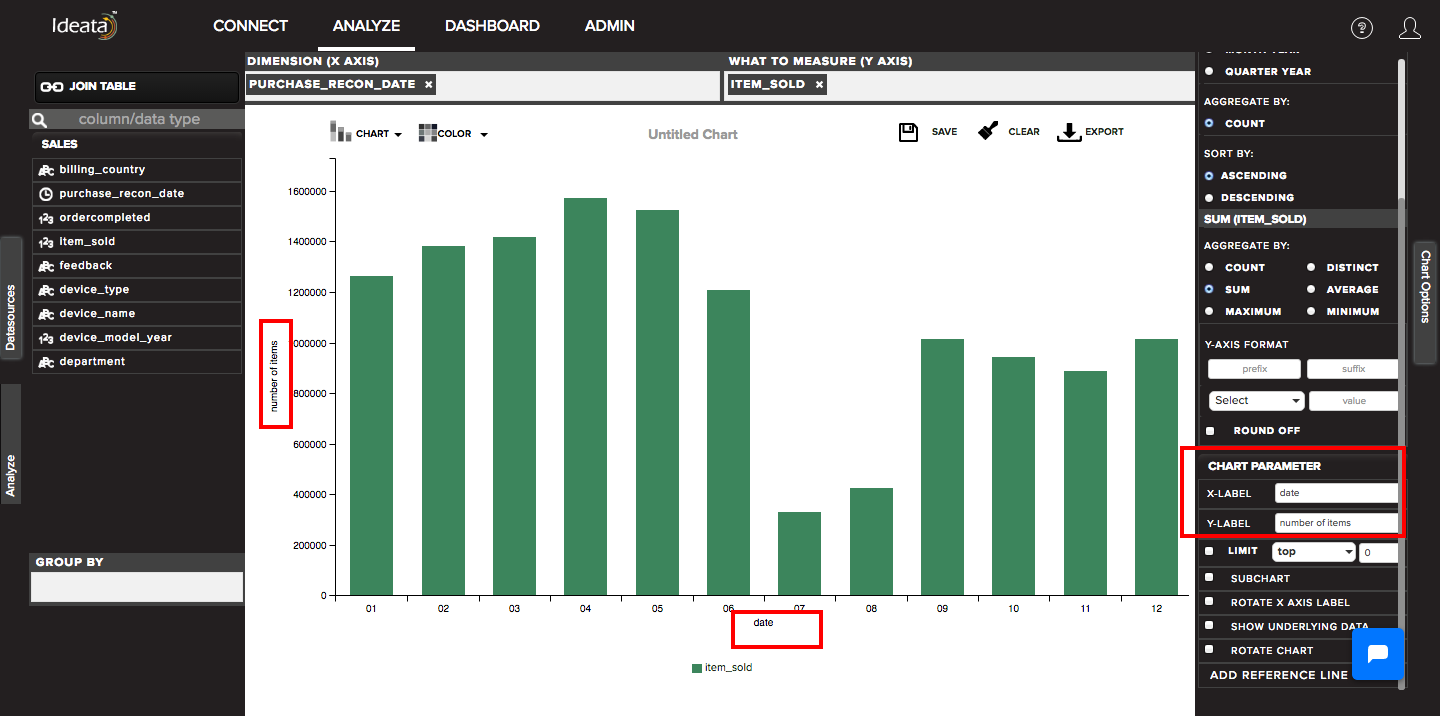
Using the right hand side panel on the data analysis interface, you can type in the desired label in text box available for x-axis and y axis in chart parametes section and it will automatically reflect on the chart area.