How to zoomin to charts datapoints by using subchart?
When we have number of datapoints on x axis in any chart, it becomes somewhat incomprehensable on analysis screen. In order to zoom in to an area of the chart to see few datapoints we can use the subchart functionality.
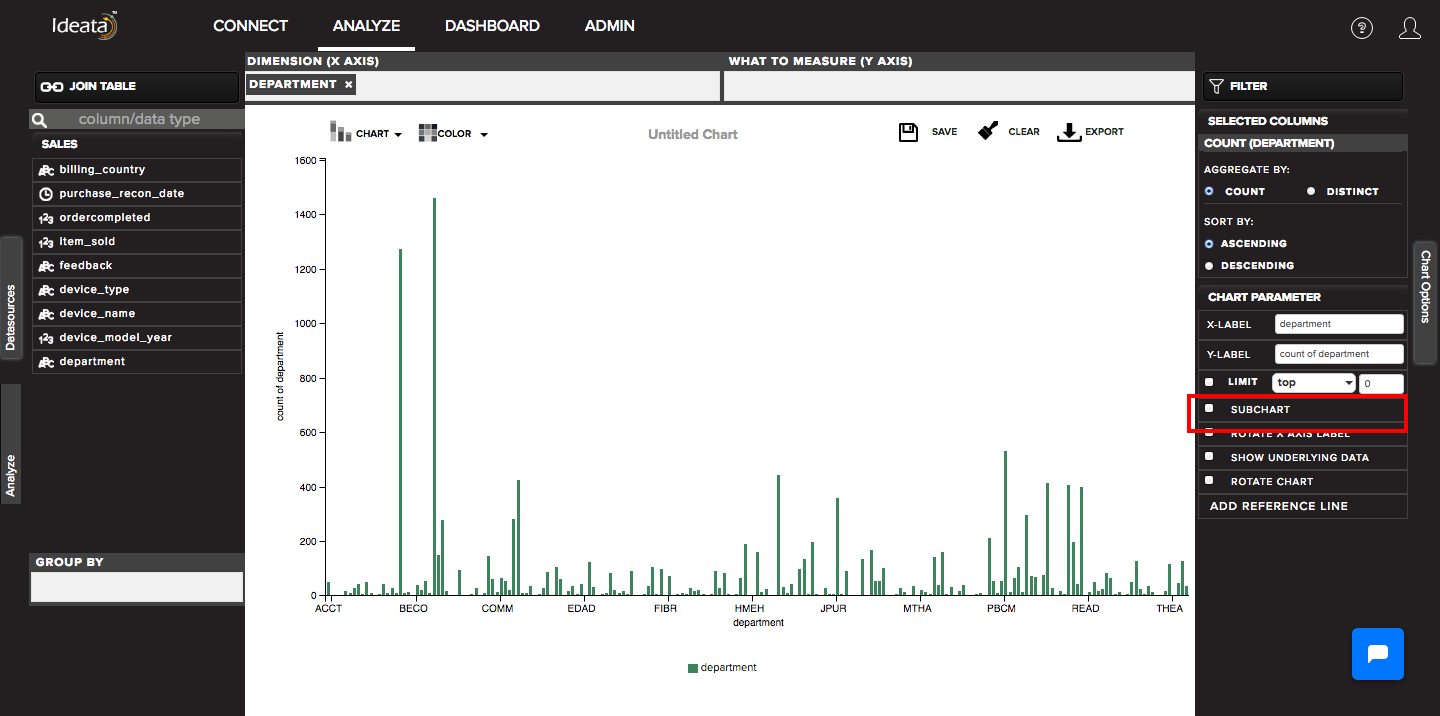
The option to see subchart chart is available on the right hand side panel of the analysis screen. You can just select the check mark to see the subchart and it will appear below the main chart.
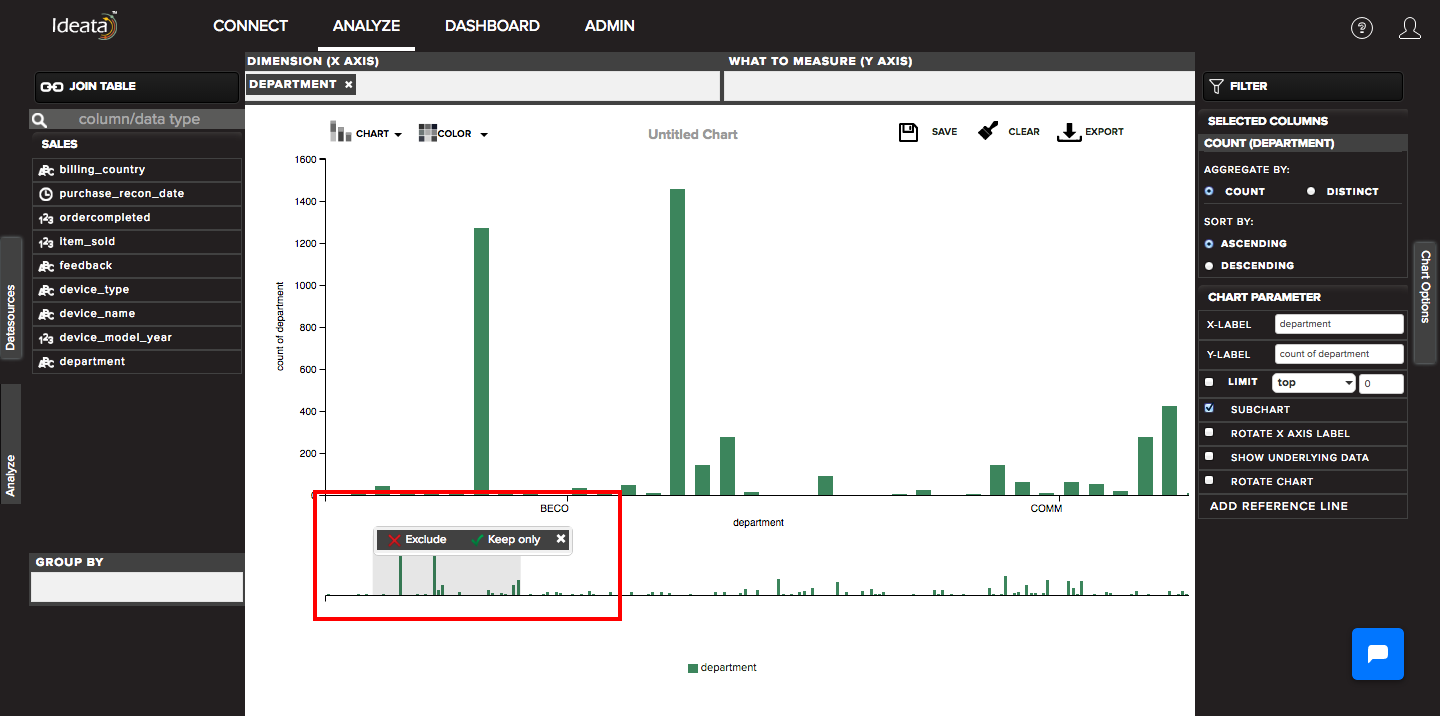
We can easily select a partcular area on the subchart to highlight and zoom in to corresponding datapoints in the main charts. The area is scrollable across x axis and also provide functionality to exclude\/include the selected portions.