How to filter data on report?
We can choose to show, or not to show some data points on the chart by using filter option on the analysis. It is available on the top corner of the anlysis screen in right side panel.
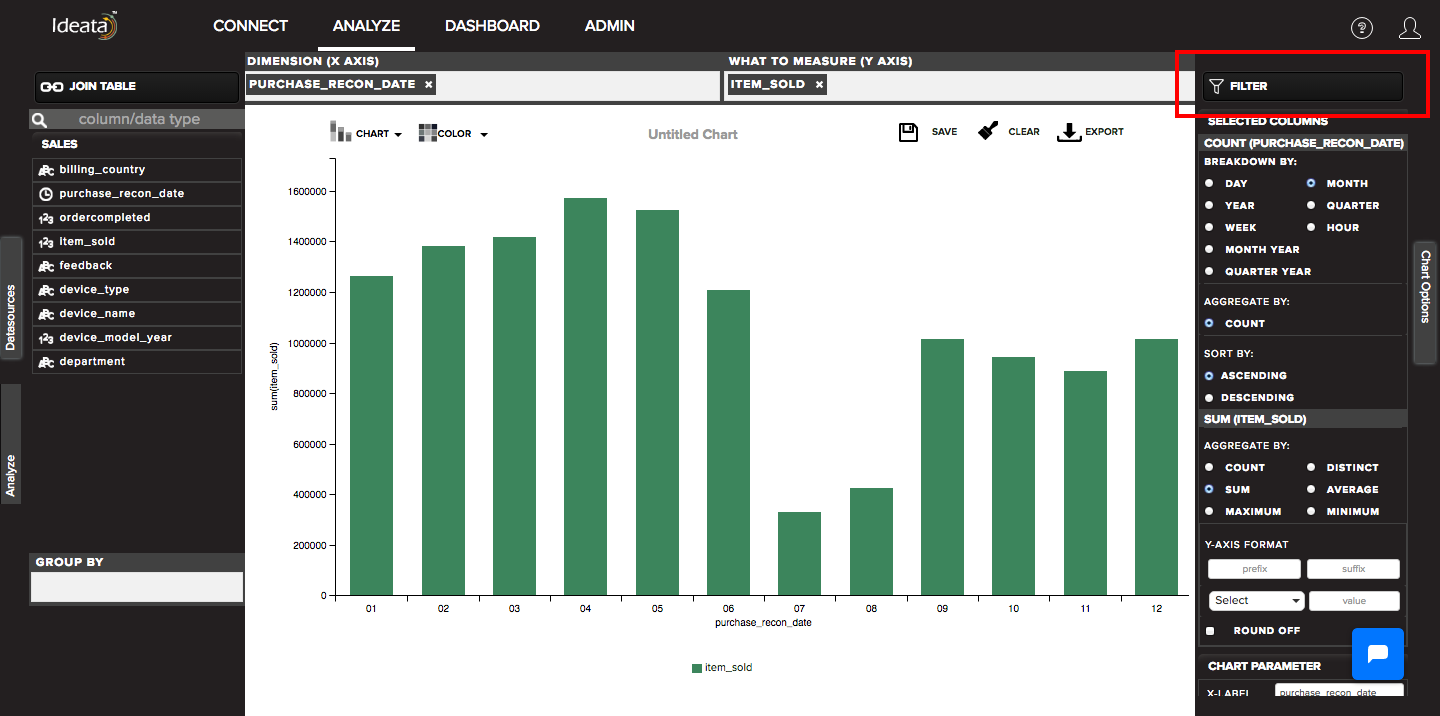
You can click on filter and it will open a pop up from where you can choose to apply and remove filters.
Filters can be applied in two ways -
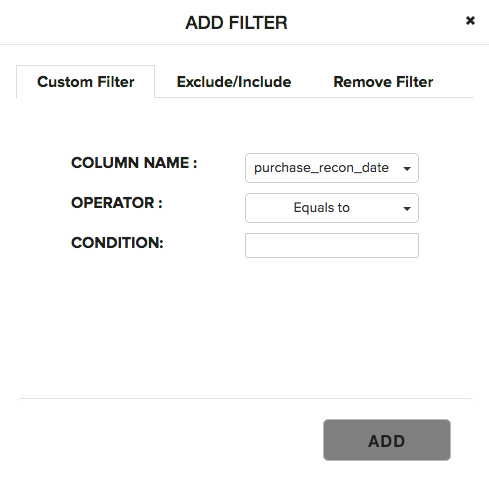
Custom filter -
You can apply any custom filter on the chart. You have to select below paramers in order to do so -
you can select the data columns from column name drop down on which you want to apply filter
apply a filtering logic in operator such as equal to, not equal to, contains, after, before, between etc.
condition where you can specify the text or numeric values of your choice
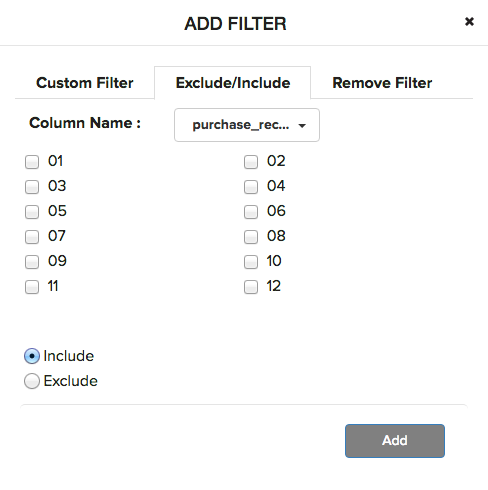
Exclude\/Include -
You can apply exclude\/include filter on the chart. You have to select below paramers in order to do so -
you can select the data columns from column name drop down on which you want to apply filter. You will only get options for the data columns which you have dragged in dimesions and measures.
you can then select the check boxes for the column values
select the radio button option either to include the selected values or exclude the selected values from the chart.
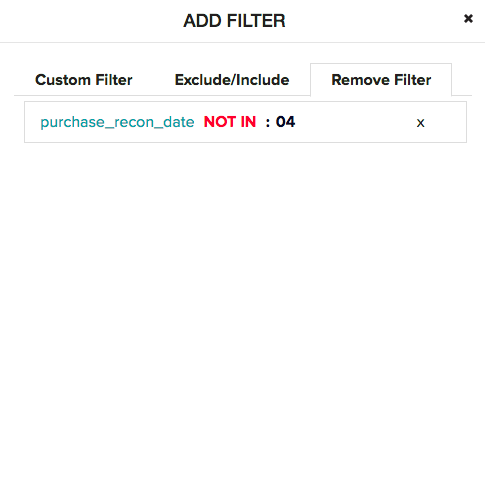
Remove filter -
You can also remove the applied filter from the remove filter tab. Select the filter condition from the list and click on cross sign in order to remove the applied filter from the chart.