How to see Top N or Bottom N vales in the chart?
If there are many data points in the chart and we want to see only some top\/bottom values like top 10 or top 5 or bottom 10, we can easily do it by using LIMIT option from chart parameters.
It is available in the right hand side panel on the analysis screen.
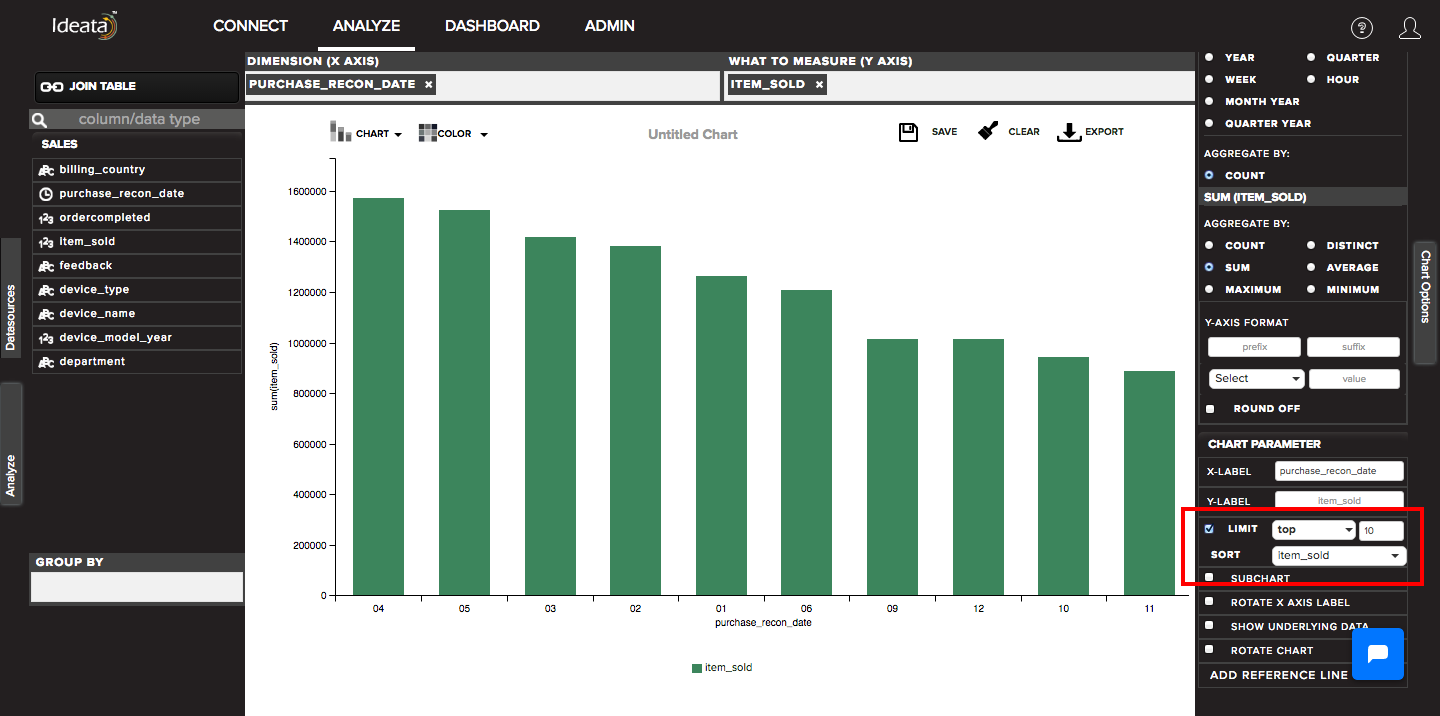
Once we drag some column in measures and dimesion, we can select the check mark on Limit and select either top or bottom from the adjacent dropdown. We can then supply a numeric field in the text box which represtents the data points which we want to see. For example if we want top 10 we will just select Limit TOP and then write 10 in text box.
Once we click back on the chart area, the report will show us the top or botton measure values accordingly.
If there are two or more values dragged in to measure (y axis), we can also choose which data column we want to choose for calculating top or botton in the sort option.