How to export charts and reports?
Once you are done with creating charts and reports, you can share them with your team by exporting it. Ideata Analytics provides capabilty to export chart in various formats .
In order to export the chart, select export option from the right top panel.
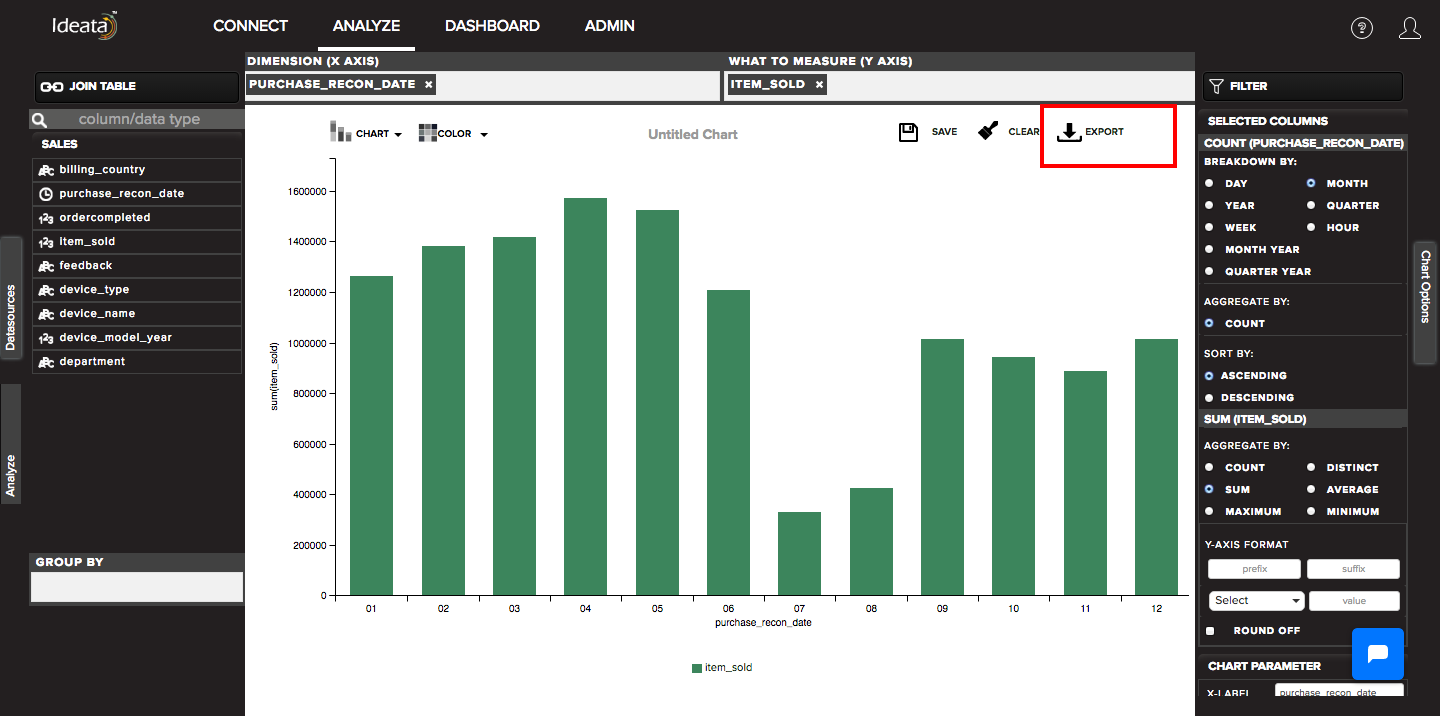
It will open a pop up which will provide option for exporting your chart in different formats.
HTML Page - It will export the html code of the chart which you can use as is
PDF - it will export the chart in PDF format
SVG Image - it will export the svg image code.
PNG Image - it will export the normal png of the chart
Excel - it will export an excel sheet which will contain chart as well as chart data
Export table data as PDF - it will export the chart data as PDF.
Embedd report - it will give you an iframe code which you can embedd in any website or web portal.
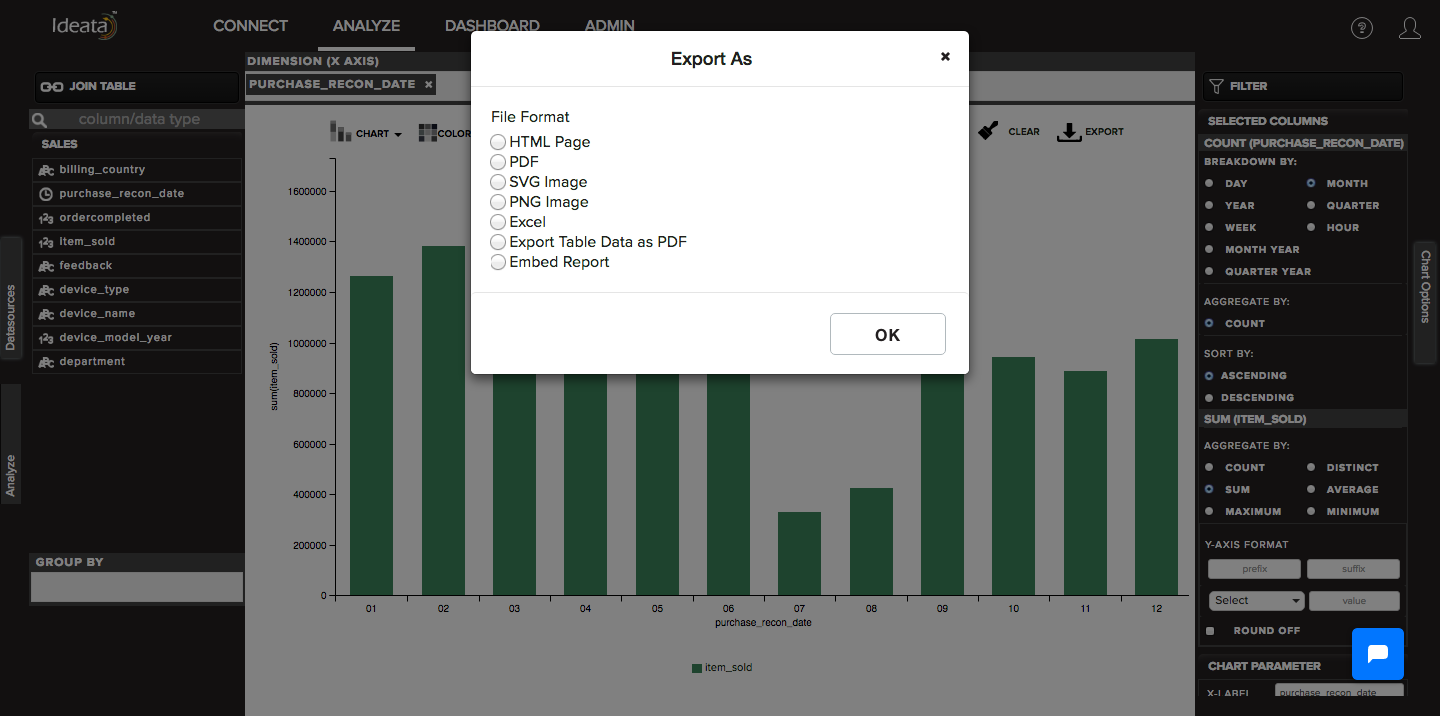 You can choose the desired format and click on OK. It will automatically export the chart and reports.