How to create Table chart?
Table chart represents the data in tabular format. Ideata Analytics provides capabilty to create table chart on analysis screen. The steps to create table chart are as follow:
Step 1: Open the datasource which you want to visualize by clicking on its name on connect screen. It will be redirect to analyze screen
Step 2: You will see the columns listed in the left panel in analyze tab of the selected datasources.
Step 3: On top panel, in chart options select the chart which you want to make from chart list. Here select Table chart.
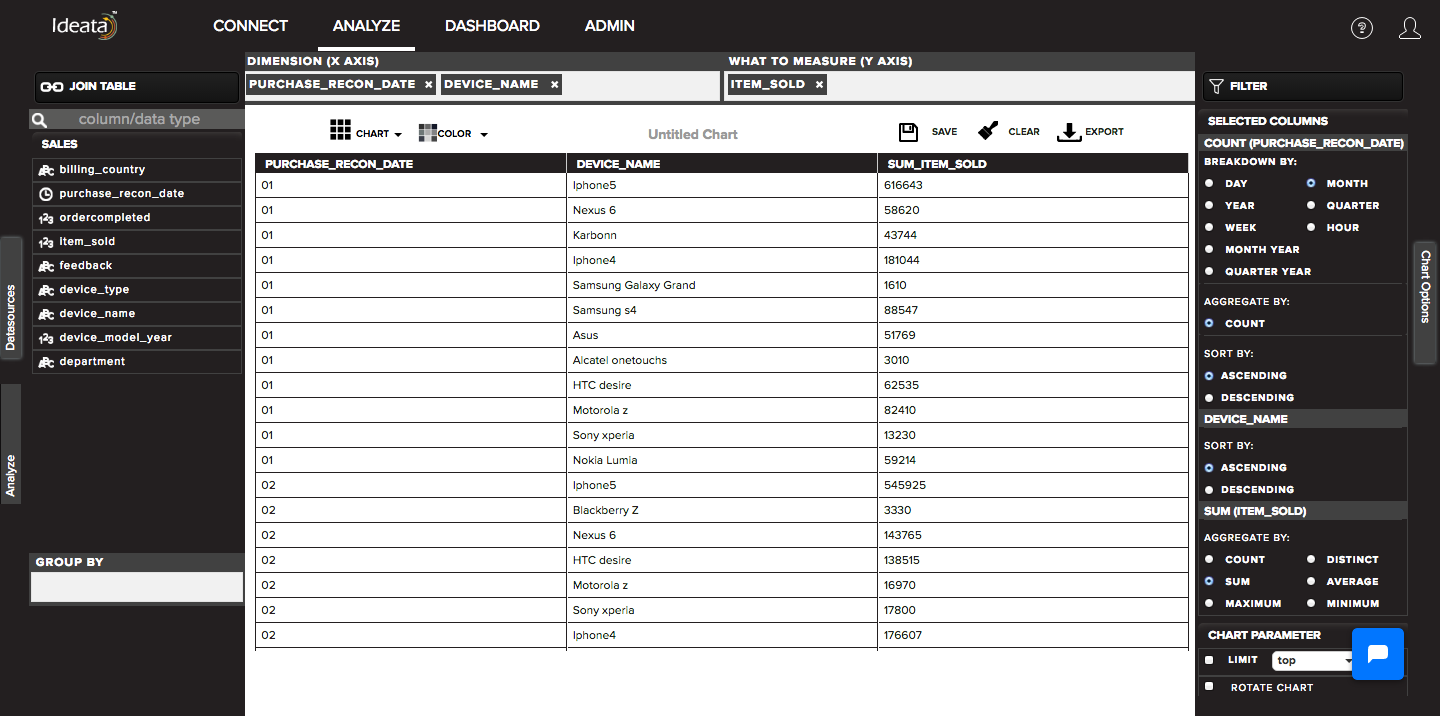
Step 4: Drag and drop required columns in to rows,columns, color which you want to visualize. Below is its significance -
Row - As a row in the table chart
Column - by default count of columns will be populated corresponding to the row.
Text- The "count" column name(in case when column dragged only in row) can be renamed by the text in this field(dragged).
Step 5: Table chart will be created respectively in the chart area which can be saved or exported.