How to change color of charts?
We can create different reports and charts on analysis screen. You can also change colours of the chart which you created on the analysis screen as you want. Ideata analytics provides some predefined set of colurs to pick and choose from.
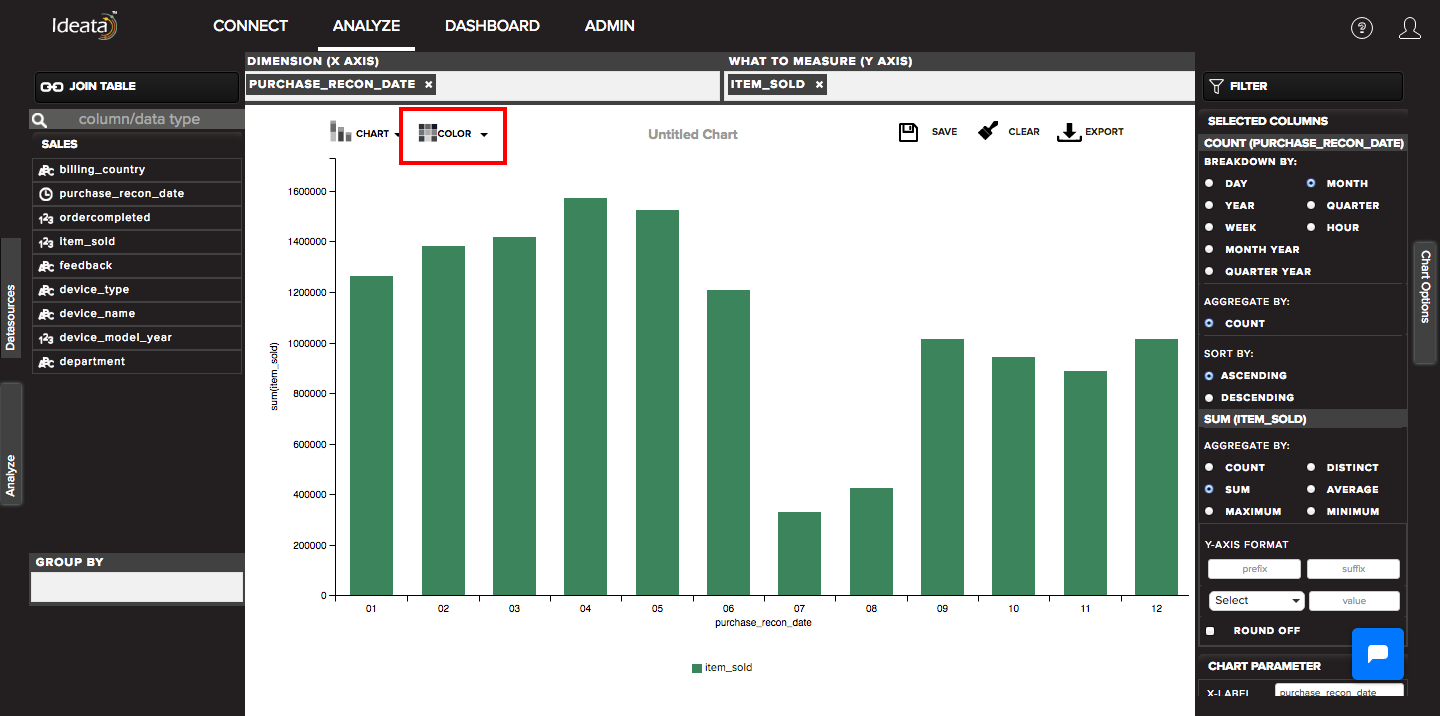
Using the left top panel on the data analysis interface, you can click on the color button:
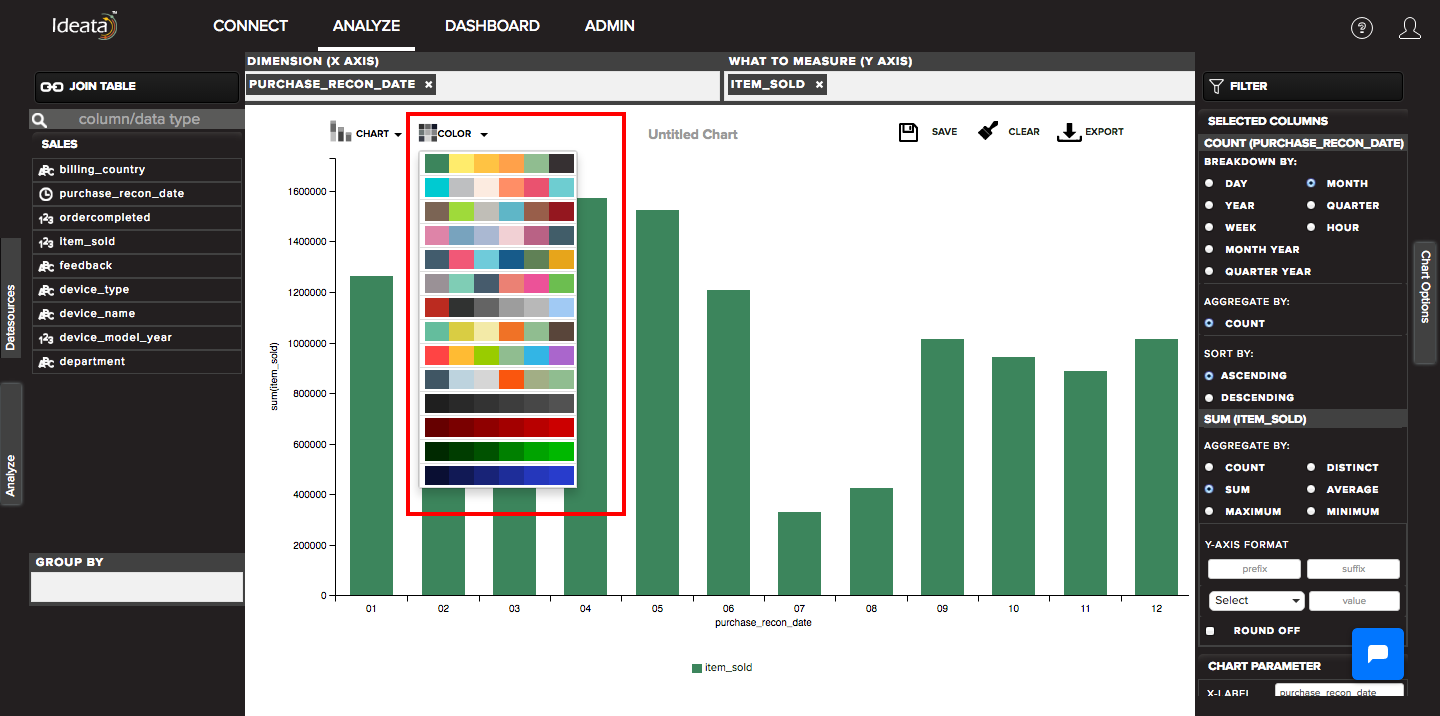
It will open a drop down with the set of colors to choose from. You can select and click on the desired color set and the chart colour will change accordingly.