How to see underlying data if the chart?
Application provides an option to see the underlying aggregated data which was used to create charts on the analysis screen. The option to see undrelying data chart is available on the right hand side panel of the analysis screen. 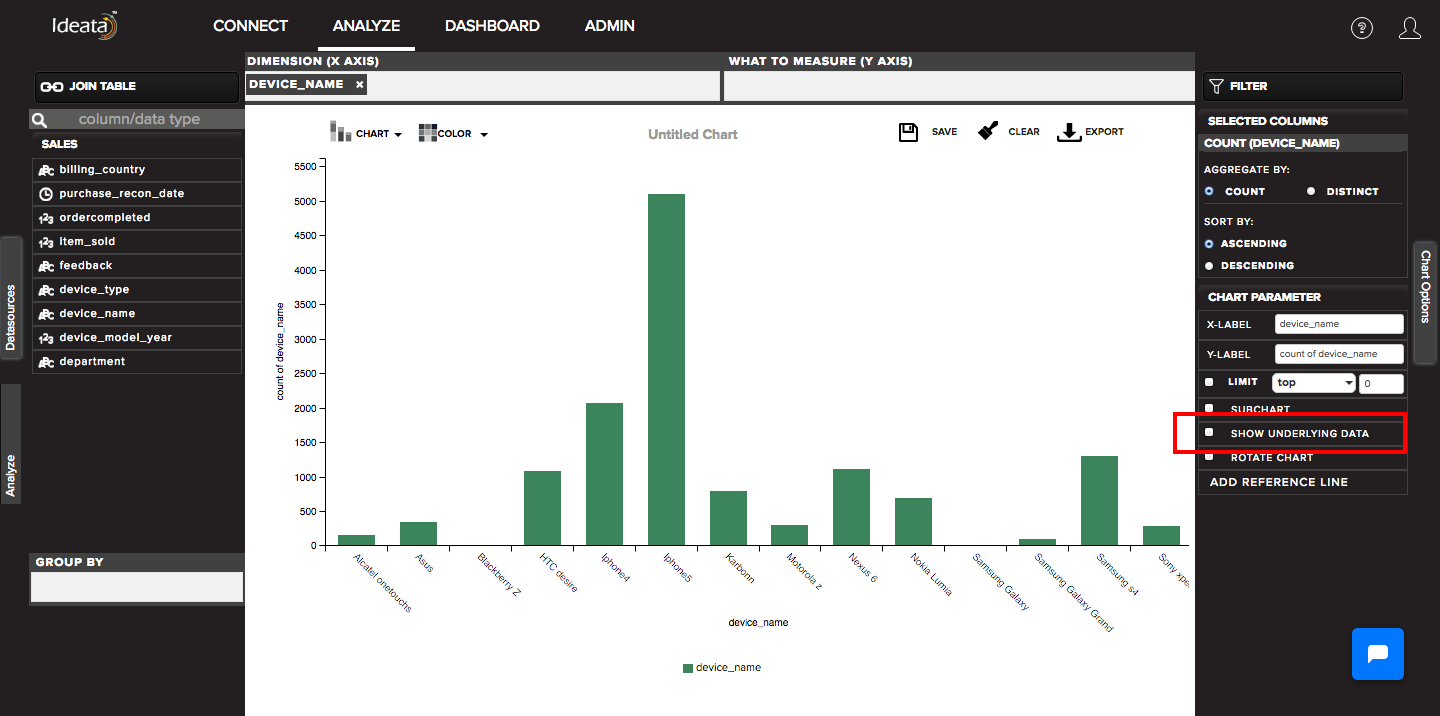
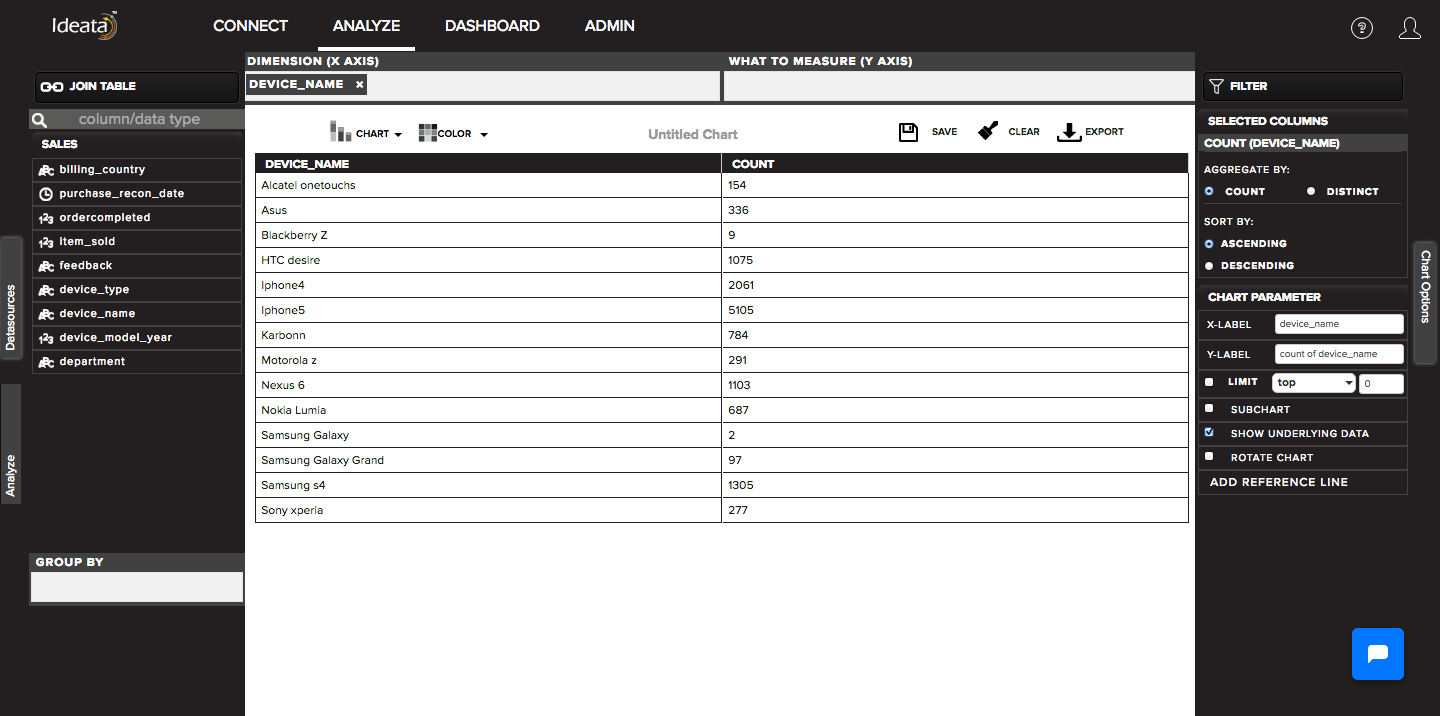
You can just select to show underlying data option to see the chart data and it will appear in the tabular format in the chart area.
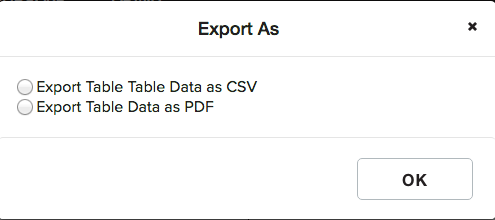
We can also export the chart data in to csv or pdf by clicking on export option available on analysis screen in the top panel.