How to add reference line to charts
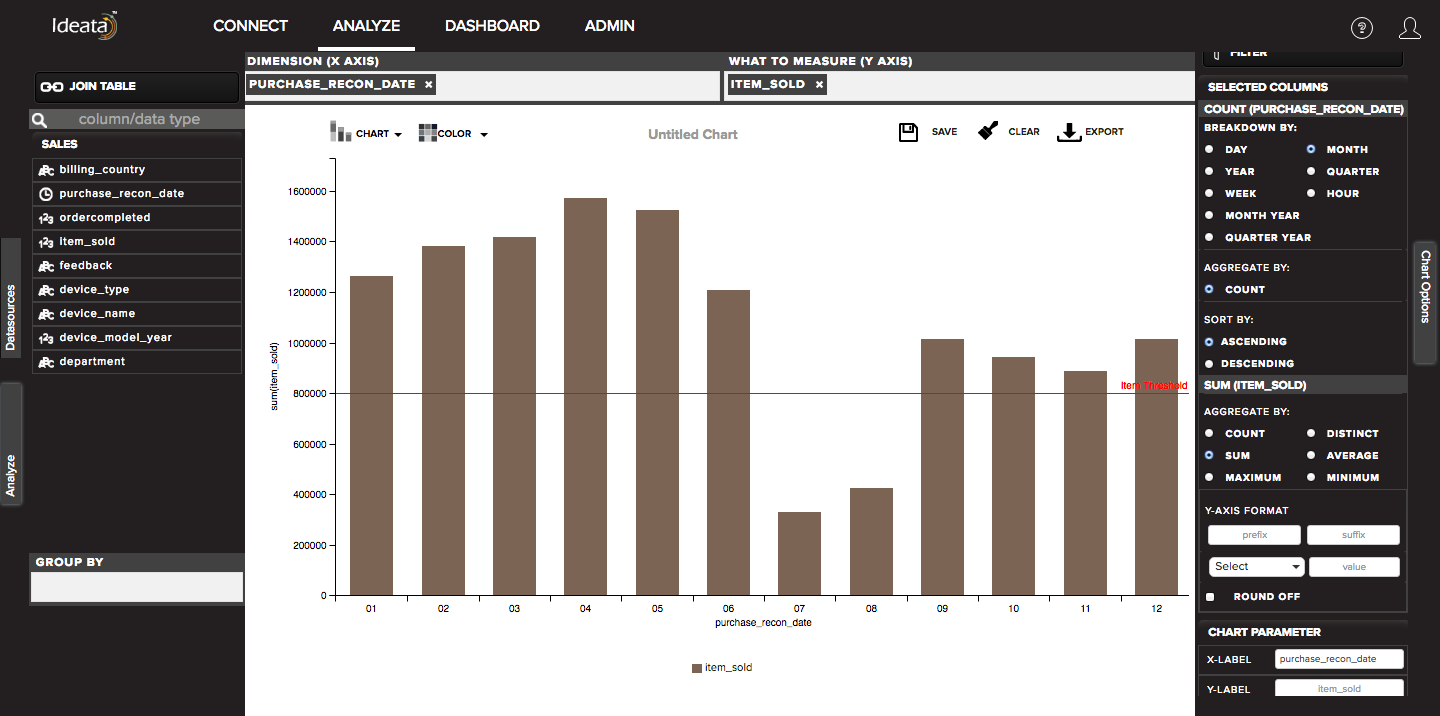
We can add a reference line in chart to show a threshold value on y axis parameter and easily distinguish between points which crosses that threshold.
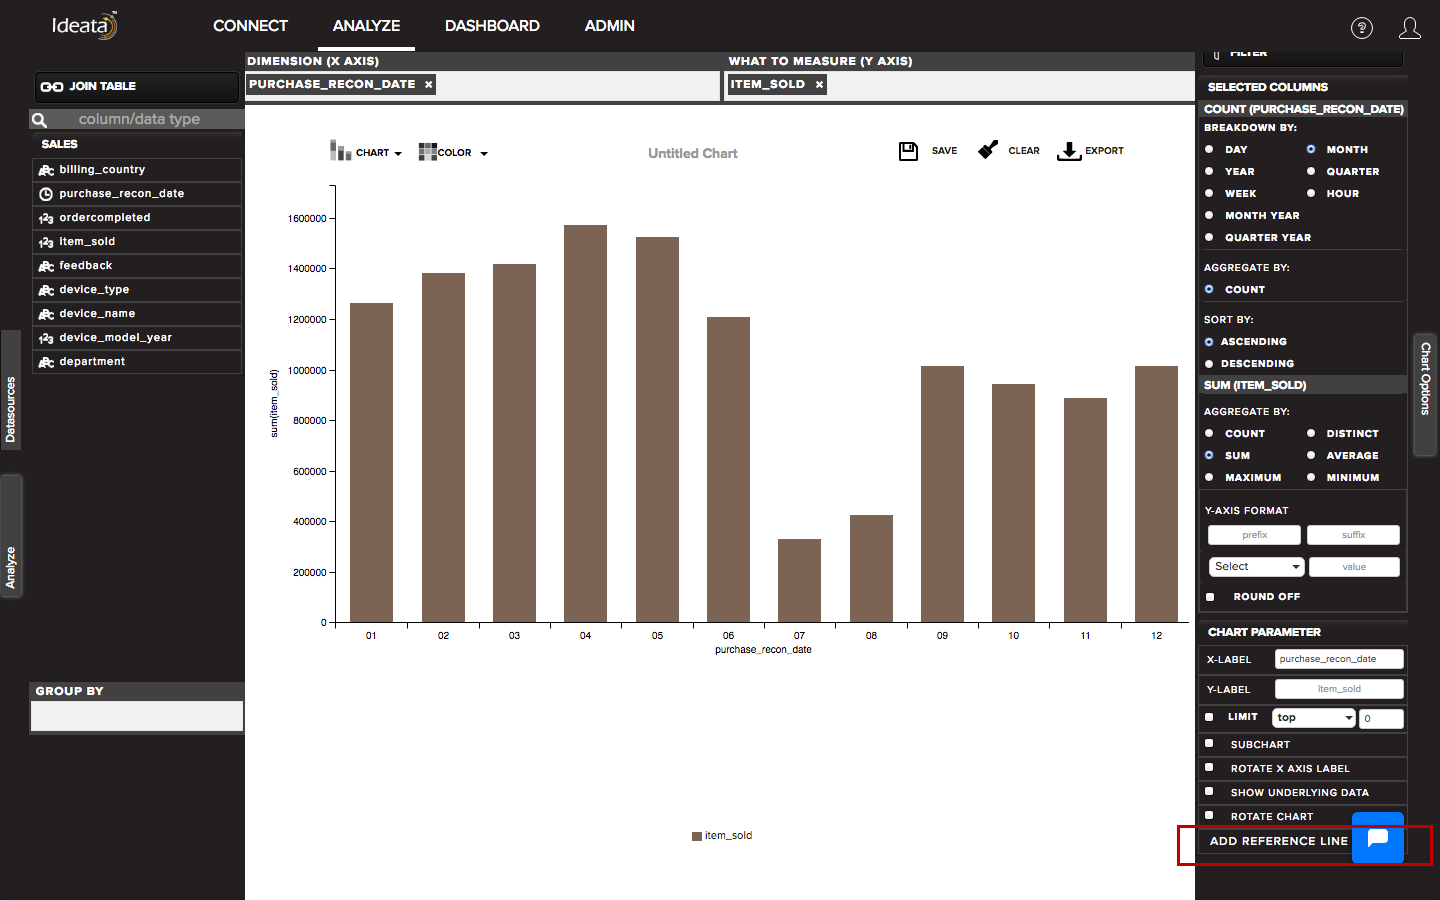
In order to add the reference line on any chart you created, go the the right panel and click on reference line.
It will open up a pop up where you can provide the threshold title which is the text that will appear on line. In value on y axis input box, provide the suitable y axis data point on which you want to draw a horizontal reference line.
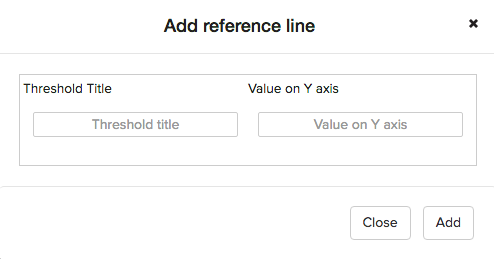
Once done you can click on add and close the pop up. It will add the line on the chart as per the data provided.