How to slice and dice data?
For any exploratory analysis, it is important to have the ability to easily slice and dice data and break it down into smaller parts to examine it with different viewpoints and gain a deeper understanding. We can perform roll ups, drill down, drill across datasets on analysis screen and reach from billion datapoints to point of interest or perfrom root cause analysis easily.
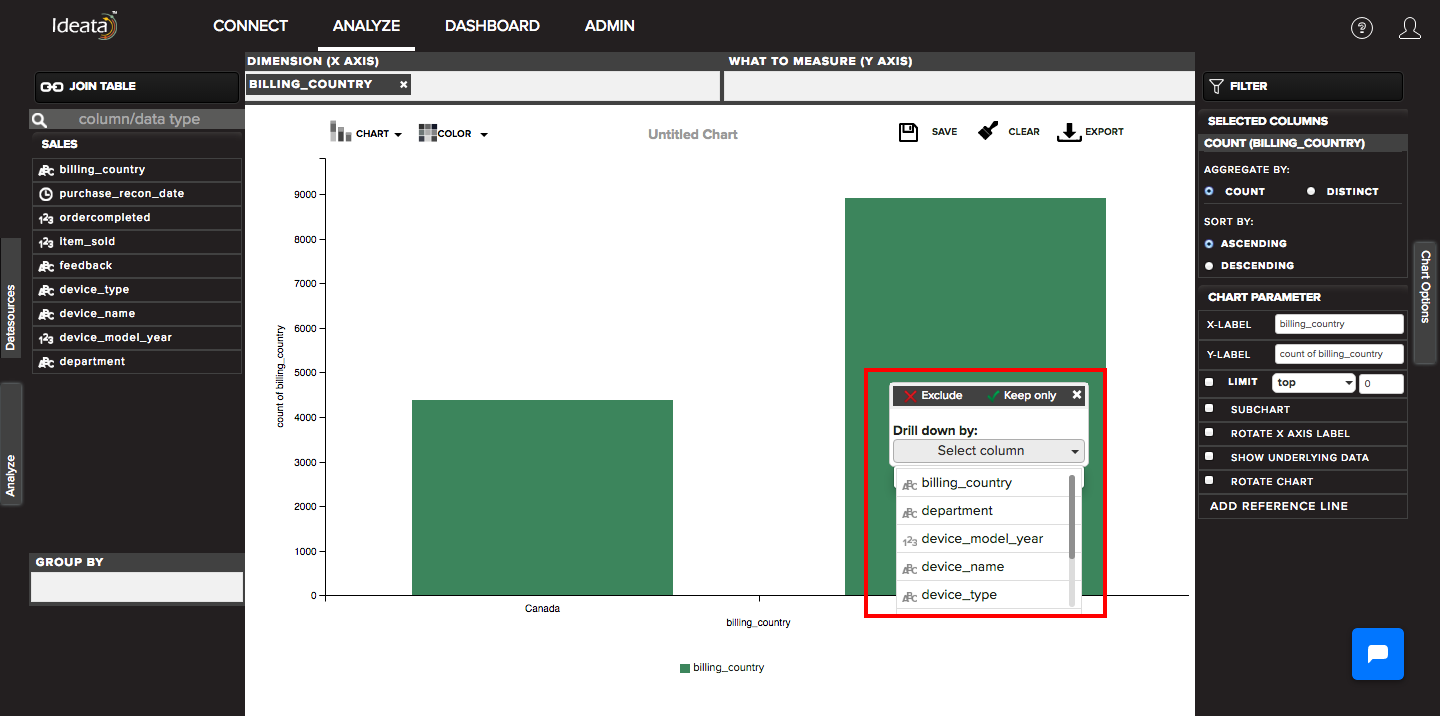
Within Ideata, you can perform these operations using the analysis screen. On the report that you create, you can click on the chart element of interest (for ex. click on bar in case of a bar chart) in the chart area. This will open the chart options in a menu box as shown in the following image.
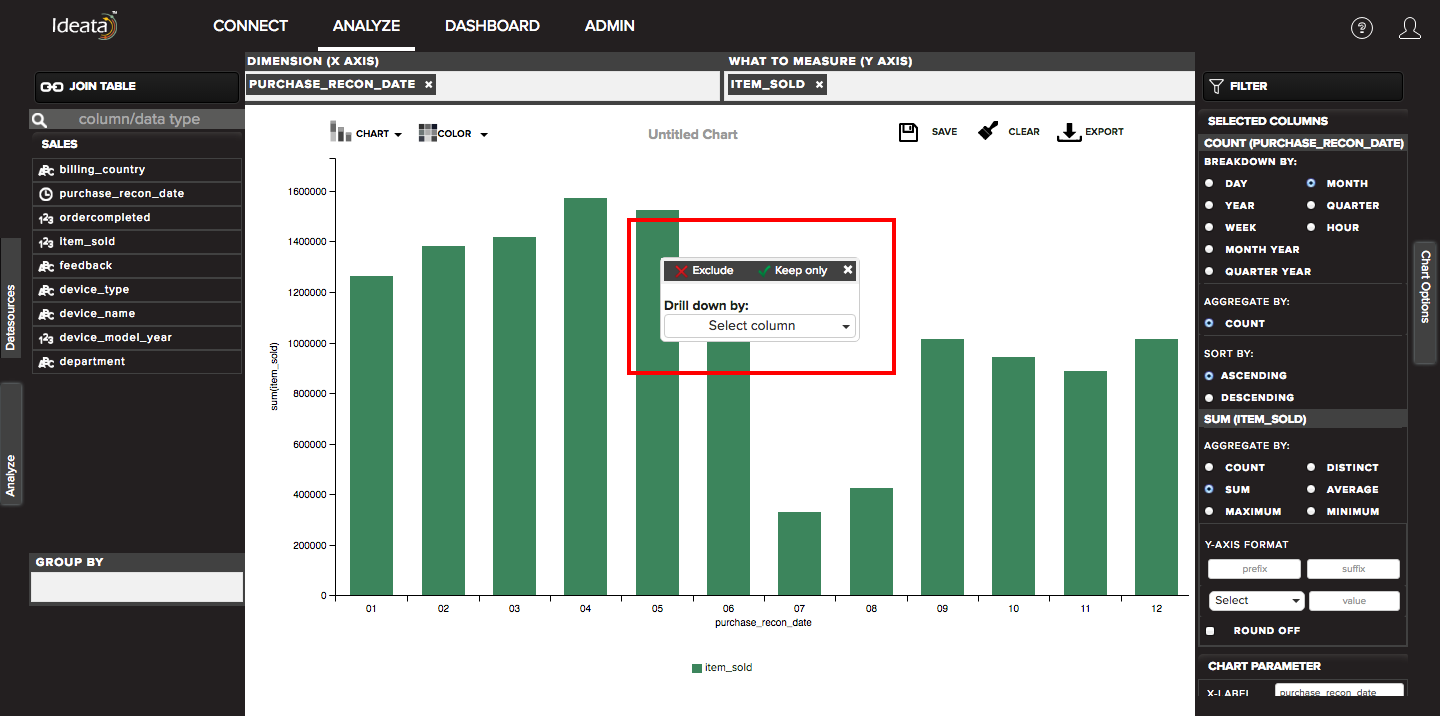
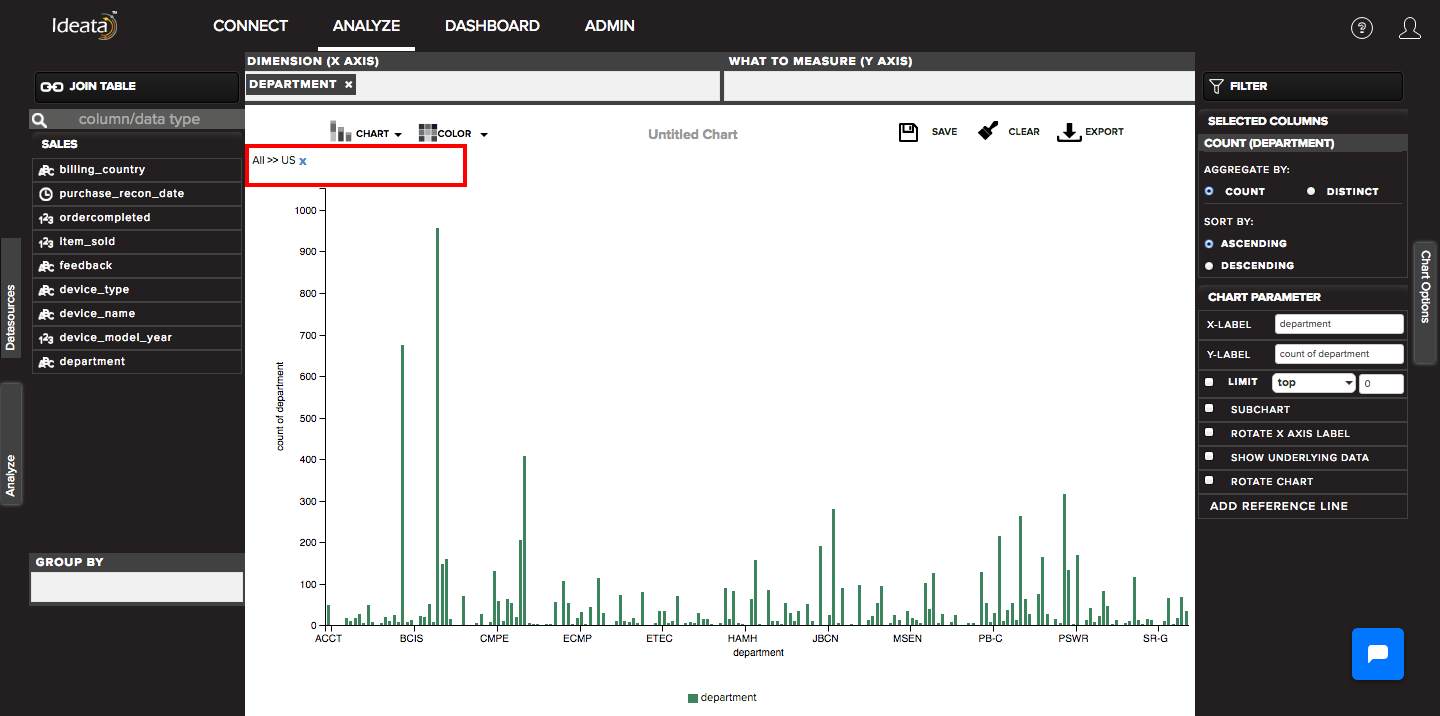
You can select to drill down data by any column of your choice using the drop down. For example - if chart is showing country, you can drill down a particular country USA by states, so that chart will show the states of USA.
Ideata gives you the luxury to perform drill downs without having to predefine any hierarchy in the data. You can trace back and roll up your data by removing the filter selection which is shown on the top of chart area. Any filters or chart configurations that you define in the drill down mode will still be available post roll up.